Oracle Property Graphs: 7 Astonishing Benefits to Enterprises
As a business executive, you rely on data to make key business decisions, from optimizing operational efficiency and marketing to mitigating financial risks. More often than not, this data is represented as tables.
While table-based graphs offer a simple representation of data, they usually don’t reveal the true relationships between the objects. Take bank transactions, for instance.
A table may show isolated bank accounts and the amount transferred from each. But in the real world, some of these accounts may be indirectly connected. Unfortunately, the table cannot tell us the complete relationship between these accounts, or how money moves from account A to Y. It’s also not obvious whether A is connected to Y. If this complex chain can be visualized, fraud and money laundering may be tracked at a glance.
Thankfully, the Oracle Property Graph bridges that gap.
What are Oracle Property Graphs?
A property graph is a set of objects (called nodes or vertices) and arrows (called edges), with the arrows connecting the objects. Each vertex and edge has a unique identifier and properties, and these are stored as key-value pairs.
The figure below shows a simple property graph with two vertices (representing bank accounts) and one edge (a transfer between them). The vertices have identifiers A and C. They both have properties name and country. On the other hand, the edge’s properties are txn_type and amount. The edge also reveals that the money transfer is from vertex A to vertex C.

In essence, a property graph is used to provide a visual representation of complex data structures in a way that efficiently reveals hidden attributes, patterns, and connections of objects. This gives us a more in-depth understanding of the data we’re analyzing, a key deficiency of table-based graphs.
Benefits of Property Graphs to Businesses
Property graphs can benefit businesses in many ways, such as:
- Optimizing manufacturing processes
- Optimizing supply chain
- Improved decision-making
- Cutting down on production cost
- More efficient marketing campaigns
- More personalized customer experiences
- Fraud detection and risk management.
And more. We’ll see how all of that works in the use cases below.
Fortunately, you can leverage the new Oracle APEX 23.1 to create property graphs using SQL queries. So if your enterprise runs on the Oracle Database version 23c, you can easily query property graphs to visualize business data in an immersive way like never before. No need for complex programming. That means more efficiency in your business.
Example of Property Graphs

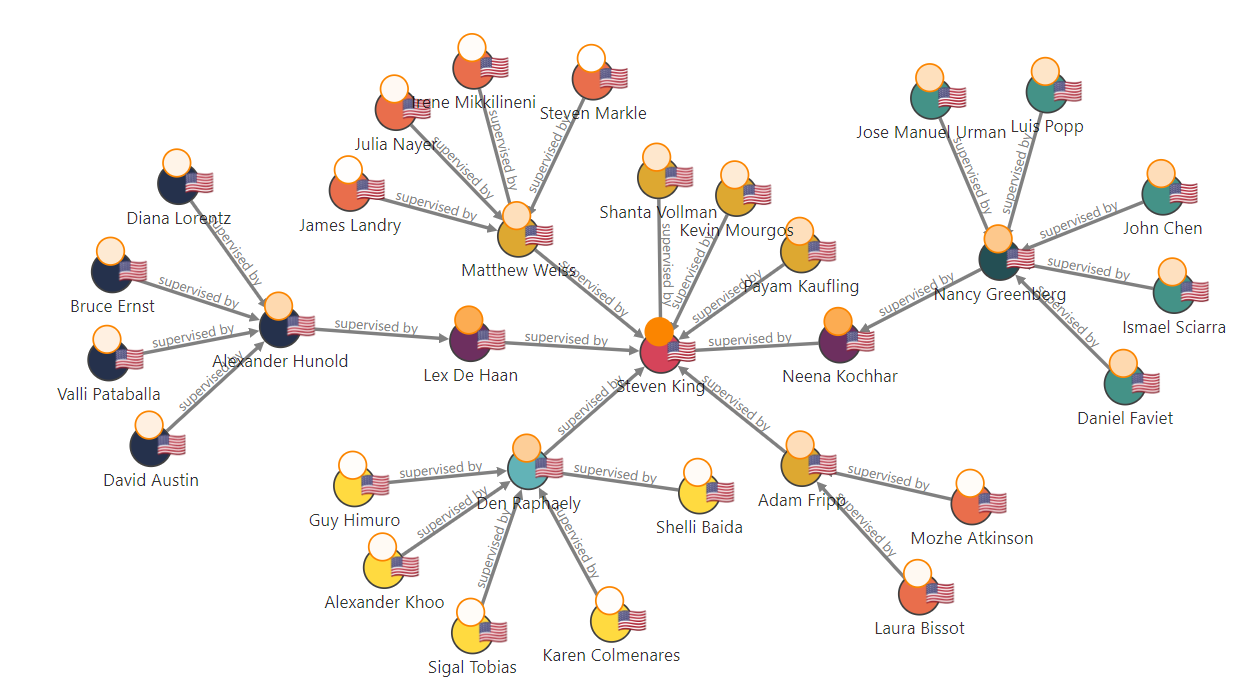
This demo property graph shows employees in an organization and how they’re connected to one another and their president, Steven King. Vertex properties are name and country. Each edge has a property supervised by identifying the type of relationship between two vertices.
In this example, we see not only Steven King’s direct subordinates (e.g. Lex De Haan and Neena Kochhar) but also who these subordinates supervise.
Suppose you’re the president. With this graph, you can identify employees who occupy key positions as well as those whose offices are redundant or underutilized. This can help you make informed decisions that optimize organizational performance.
So, how do you create this graph?
You can build the graph as a view on relational tables. The vertex table provides personal data of the stakeholders such as name, country, job title, employment date, department, etc. Each row will become a vertex in the property graph. You can pick which columns of interest become the properties of the vertices. In this case, only the name and country are chosen as vertex properties. On the other hand, the edge table provides the relationship between vertices. You can also choose which columns will be used as edge properties.
All of that is easy to achieve on the new Oracle APEX 23.1, which allows you to query SQL property graphs using the GRAPH_TABLE operator. Make an SQL query to generate a JSON output, then use the Oracle APEX Graph Visualization (Preview) plugin to visualize the graph. This plugin is free. Find the plugin here.
The best part is, you don’t have to copy data when creating graphs on Oracle APEX. Whenever you update data in your relational table, the property graph automatically updates to reflect these changes. So, you can easily see what’s happening in your organization in real time.
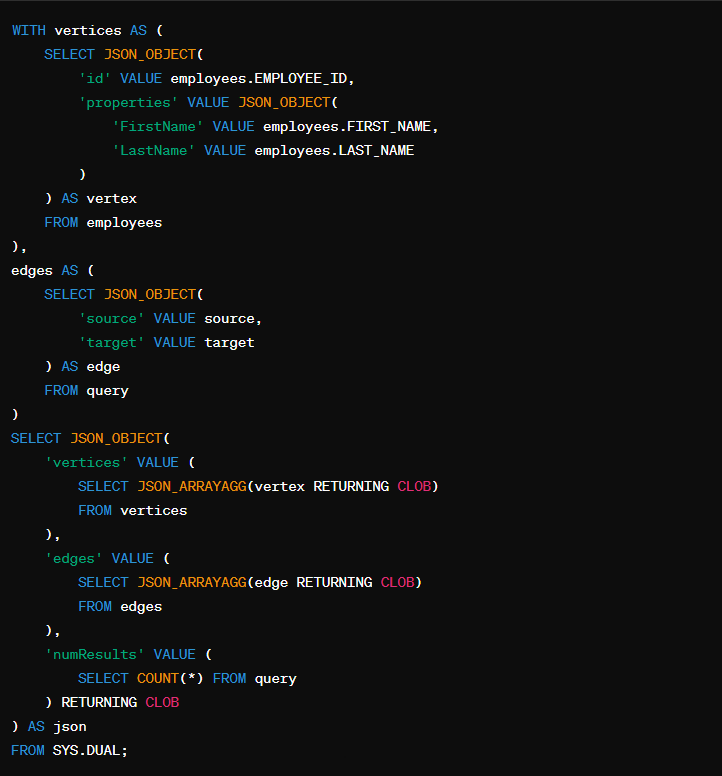
Here’s the SQL query we used to create our demo graph on APEX:
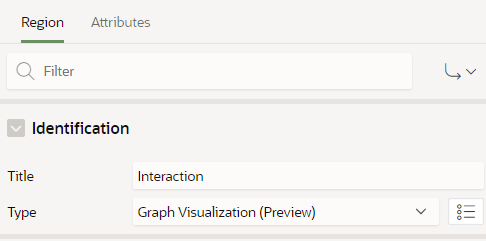
Here’s how to style the graph:
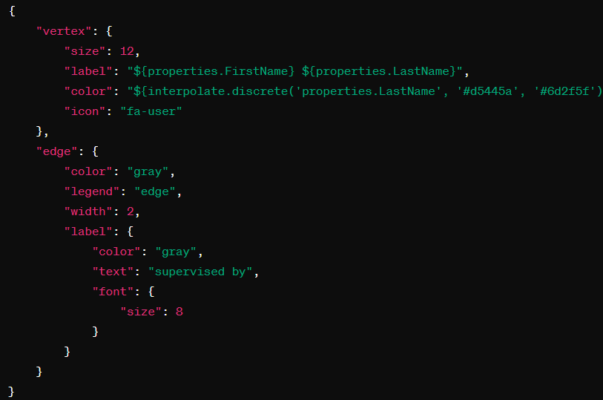
Then, select Type as “Graph Visualization (Preview)” to create and visualize the graph.
Common Use Cases of Property Graphs
Now, let’s consider some critical business concerns that can be solved when you look at your data as a graph.
1. Personalized Marketing and Product Recommendations
Property graphs can be used to model customer profiles, purchase history, and preferences in order to offer them more personalized marketing. Nodes in the graph represent customers, while edges capture relationships and behavior patterns.
For example, the graph may reveal that certain customers have shared interests and similar purchase patterns. It becomes easier to guess what product a new customer that fits into this demographic will need.
Hence, analyzing this graph enables marketers to segment customers based on similarities and deliver targeted marketing campaigns and personalized product recommendations. This can aid up-selling and cross-selling, thereby improving revenue and customer retention.
2. Fraud Detection
One of the most critical use cases of property graph is fraud detection and prevention. Consider the employee illustration above. In this context, vertices represent bank accounts and edges represent cash transfers.
By visualizing this graph, analysts can quickly identify suspicious patterns such as when funds repeatedly move through multiple dummy intermediaries or in a cycle back to the same account. This could indicate fraudulent activity like money laundering or circular trading.
Financial institutions may therefore use sophisticated anomaly detection algorithms to analyze the behavior of the graph in real-time and flag such suspicious activities as soon as they’re noticed, mitigating financial losses.
3. Supply Chain Optimization
Another popular use case of property graphs is in supply chain optimization. In this context, businesses model the graph to represent the network of suppliers, distributors, inventory locations, and transportation routes. Within the graph, nodes represent these entities, while edges depict relationships and dependencies between them.
By visualizing the supply chain network in one view, businesses are able to find the best and shortest transportation routes as well as relevant suppliers and distributors. This can further reduce costs and improve service delivery.
But that’s not all. These graphs may reveal potential risks and demand fluctuations through historical data as objects move from node to node.
3. Identifying Vital Production Parts
Do you often wonder which parts are most essential for production and how changes to one part may impact other components?
To find out, you may have to conduct impact assessments and simulate scenarios (such as removing a part) to predict how this change will impact production or product quality. A property graph can show this at a glance without any complex programming or 3D simulation. Simply represent production parts as vertices, while edges signify dependencies or interactions between parts.
You can also leverage this approach to determine if you have more employees than you need, such as in the above illustration. Whether for production or employment, in the end, you enhance operational efficiency and save costs.
4. Optimizing Manufacturing Processes
Manufacturing companies can optimize manufacturing processes by visualizing their workflows on a property graph. Within the graph, nodes represent manufacturing tasks or processes, and edges denote dependencies or sequencing requirements between tasks. A simple analysis of this graph may help you identify bottlenecks and optimize resource allocation for improved productivity.
5. Public Safety and Community Insights
Property graphs may also be used by law enforcement to enhance public safety and community well-being by modeling social networks, crime data, and community dynamics. To achieve this, vertices will represent individuals or entities, while edges signify social connections, interactions, or incidents. Law enforcement agencies and community organizations can then view the graph to identify influential community members or predict crime hotspots.
6. Creating algorithms
If you manage a tech company or a growing social media app, you want to be able to recommend relevant elements such as influencers (who to follow), communities, and posts to users. You may also need algorithms for page ranking, machine learning, and pathfinding for your SaaS product.
Thankfully, Oracle APEX provides in-memory algorithms that you can run out-of-the-box using the Oracle Graph Server. These algorithms are not only valuable to tech businesses but can also be used to detect fraud or provide safety measures in business and healthcare.
Graphs are capable of this because they can help identify important nodes, such as influencers on social media. These nodes are where several other nodes and edges converge. They can also help us determine a node’s importance by identifying where the edges originate, much like how Google ranks a page based on the reputation of the sites linking to it.
Next Step
As you can see, there’s so much you can achieve in your enterprise using property graphs. From personalizing your marketing to optimizing supply chain and detecting anomalies, the benefits are quite significant. And Oracle APEX makes querying property graphs quite straightforward. If you already have relational tables and data analytics, simply use the Oracle APEX “Graph Visualization (Preview)” plugin to get started. Less coding, more visual clarity.
If you need expert guidance on querying property graphs to analyze your business data, I can help.